
 The stock market roared this past year, gaining over 28% and serving up the best performance since 2013 when it gained over 29% for the year. There are a lot of things driving that performance. The recovery, now over ten years old, is one of the longest on record here in the U.S. Unemployment is at a multidecade low. Real wages are climbing, and consumer confidence remains solid. Corporate earnings continue to grow albeit at a slower pace than past years. Interest rates remain at historic lows and this trend looks to continue for the foreseeable future.
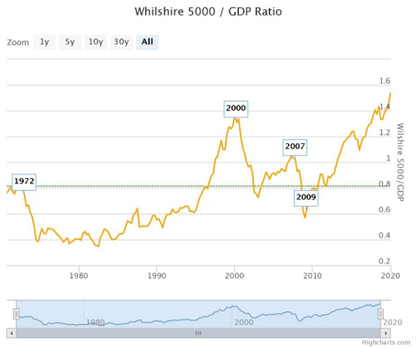
However, all is not necessarily smooth sailing. There are a few clouds on the horizon. If you will recall at this time last year the Federal Reserve changing their tone from “we need to keep raising rates” to “we will cut if needed”. This sparked a rally from the nearly 20% decline we saw through late December of 2018. The Fed did cut interest rates during the year, largely in response to economic weakness surrounding the ongoing trade war. In addition, we had a warning signal that flashed in late March. This was of course the notable “yield curve inversion” which occurred when the interest rate on a 2-year Treasury note was higher than the interest rate on a 10-year Treasury bond. Historically speaking, such inversions have been harbingers of recessions within the next 12 – 18 months. And yet the market kept plugging along despite these warning signals and bad news. In August we had the trade war ramp up with an increase on existing tariffs and new tariffs implemented, though the administration did back off on the last round of threatened tariffs on most consumer goods until mid-December. This delay coupled with an additional interest rate cut forestalled the possibility of an imminent recession. And the market kept plugging along. In December we were given a “phase 1 trade deal” that really does not seem to have gone very far. It offers up some agricultural purchases and a few hints at intellectual property protection but is not nearly the sweeping reforms that were called nor needed when this trade war began. And the market continued to plug along. Where are we at now? Are we in for more of the same in the coming year? Or will that recession that was forecast in March and many feel is overdue finally make an appearance? While earnings are expected to actually fall for the 2019 fourth quarter, most analysts expect earnings to rebound slightly in 2020 at low single digit growth rates. This leads to an expectation of stock returns in the high single digits for the coming year. As for me I can honestly say that I have no idea. At the risk of sounding like a broken record I am cautiously optimistic. Until we see more definitive signs of the economy breaking down, I have no reason to not be invested in stocks. But there are a few warning signs that I am paying attention to in the economy and the markets. One warning sign for me is the lack of capital expenditures by companies. Capital expenditures refers to investments back into a company to promote future growth. This would be things like new plants or new equipment which would presage more growth down the road. One benefit that was supposed to come from the massive tax cuts corporations received at the end of 2017 was an increase in capital spending leading to higher growth in the economy. This was how the tax cuts would end up paying for themselves. The higher growth would lead to higher tax revenues. What we are seeing though is falling capital expenditures and only marginal earnings growth. This worries me. Companies shy away from making capital investments when they think there is a lot of uncertainty about the future growth prospects. When we had the ongoing trade war it could be argued there was a lot of uncertainty about future growth prospects. In theory though this has been resolved. Unless we see a significant pickup in spending in the next few months, I would argue there is still a lot of uncertainty surrounding growth and we are more likely to see a recession than an economic boom. Another warning sign for me is also a Warren Buffett favorite. As you may know a key measure of how our economy is doing is the Gross Domestic Product or GDP. This measures the value of all goods and services we produce in the U.S. annually. The Wilshire 5000 Stock Index is the broadest index of stocks in the U.S. The St. Louis Federal Reserve bank tracks the total value of the stock market relative to the GDP of the U.S. The growth in the stock market should somewhat parallel the rise in GDP. Stock prices should rise as earnings for the underlying companies increase and earnings should increase if the total output from the U.S. economy is growing. With data from the St. Louis Federal Reserve, we can track this ratio back to 1971. For most of the 1970’s though the mid-1990’s, this ratio was below the 80% level. This means the total stock market value was at or below 80% of the total value of the U.S. economy. In 2000, this ratio peaked at 134% only to fall back below 80% by 2003 in the recession. This ratio rose again through 2007, where it was over 100 again before plunging to 60 in early-2009 during the Great Recession. Why do I bring this up? Currently this ratio stands at an eye-popping level of 153% as of 2019 year-end. In other words the value of the stock market has increased much faster than the value of our total economy. Can this high valuation continue? Sure. However, I fear this trend is not sustainable. There are three possible outcomes to this ratio. The first is that that economy heats up and “catches up” but this would not be good for stocks. If the economy started growing that rapidly it would likely bring with it much higher inflation which would lead the Federal Reserve to hike interest rates which would hurt stock prices. The second possible outcome is that stock prices plummet – as in a market correction. This has already been the result to two past peaks – 2000 and 2008 – and a third correction is not out of the question. The third scenario is some combination of the two – the economy grows faster while stock prices either stagnate or fall some but not tumultuously leading to a closing of this gap. Given these possible outcomes, you can see why I keep the ‘cautious’ in ‘cautiously optimistic’. Another caution flag that is waving is coming from the Federal Reserve itself. While the Fed signaled that rate hikes were not imminent, there was a notable sound of concern that came out of the December Federal Reserve meeting. Several Federal Reserve members expressed concern that low interest rates might encourage “excessive risk taking” in the financial markets. I would argue this sentiment is long overdue. There are many who think we are in an “asset bubble” caused by the low interest rates for such a long period of time. The longer we maintain low interest rates, the more investors are pushed to invest in riskier assets for some sort of return. With all the uncertainty in the markets and an administration that governs by tweets and gut feeling raising interest rates would only choke off whatever small investments are being done currently. Pile on top of all these issues an election year with a very uncertain Democratic field and you have a recipe for, at the very least, a fair amount of volatility. As I write this letter, we are in the midst of tense times with Iraq, Iran and the U.S. There are threats from both sides for strikes and retaliations. Typically speaking, this would lead to a sell-off in stocks, but the market keeps shrugging off the bad news and inching ever higher. Barring extraneous circumstances such as an outright war or a resumption of the trade war with China I do not see a recession on the horizon this year. I think the Federal Reserve will do everything they can to push that possibility off as long as possible. I think our economy will essentially continue to muddle along at a 1 - 2% growth rate. This mix of good news and cautionary news means that we are not making any significant changes to portfolios. Last year, I indicated that I was reallocating client accounts, using a fair number of mutual funds when and where appropriate. I have not given up on the individual stocks as that has served us quite well. In fact, many of the stocks we have owned this year have done very well. For example as of year-end shipping company Seaspan Corp (ticker: SSW) has returned over 39% for us; Kenon Holdings Ltd (ticker: KEN), a holding company that holds interests in different businesses around the world, is up over 35% for us and homebuilder Meritage Homes (ticker: MTH) gave us a 45% return before we sold out of it completely in late-December. In my last letter I mentioned that I am using options a bit more strategically now. I specifically referenced two different trades – one on Sanmina Corp. and one on Dick’s Sporting Goods. The Sanmina options trade finally expired on us in late-December. In the end, we earned just over $139 while only risking $2,900 in total. This doesn’t sound like a lot, but it means that we invested $2,900 and earned a 4.81% return on the money. That is not too shabby. As for our trade in Dick’s Sporting Goods that one did not quite work out the way I had planned. We had obligated ourselves to sell Dick’s at $40 only to see the stock pop dramatically from just under $40 in late-November to well over $46 per share in one day. We chose to buy back the option we had sold, which resulted in a loss, but we kept the stock which has continued to work its way towards the $50 per share mark. Perhaps at some point again we will sell more options against our position if the timing is right. We are continuing with this theme of strategically using options on stocks we want to purchase. We recently entered a trade that obligates us to purchase shares of Discovery, Inc. (ticker: DISCA), the owners of the Discovery Channel, Animal Planet, Food Network and other cable channels, for $30 per share. We have taken in just over $80 in premium for this obligation which gives us a 2.7% return on the amount we are risking. We may end up earning a bit more if we extend our obligation. We have a similar strategy in Chipmos Technologies (ticker: IMOS), a maker of integrated circuits. This strategy has earned us a 3.94% return so far and, again, we may end up with more if we extend the timing of our obligation. We won’t always resort to options when we have stocks we want to purchase, but if the strategy seems appropriate and earns a reasonable rate of return it makes sense to go this route. The mutual funds we own did reasonably well adding stability where we wanted it and growth where we needed it. For example, the Janus Henderson Multi-Sector Income fund (ticker: JMUTX) is a bond fund and would have a much more muted return than something like the Parnassus Mid Cap fund (ticker: PARMX) which we also own. During the fourth quarter, the Janus Henderson Multi-Sector fund gained 1.65% while the Parnassus Mid Cap fund grew 3.42% for the same period. However, the bond fund was not purchased for growth. Rather it pays a current dividend of 3.35% while the Parnassus fund which is designed for growth only pays a measly 0.50% in dividends but grew over 28% for the year. On the surface you may wonder why we didn’t just put everything into the Parnassus fund (or something similar) for the growth. The simple answer is there would be entirely too much risk in doing that. Rather than try to “time” the market it is far better to have a reasonable asset allocation that matches up with a client’s risk tolerance. The goal is to end up with a more stable return that exceeds your individual needs. Towards that end, we are continually looking for ways to improve the results for you without taking on additional risk. As always, we truly appreciate the trust you have placed in us, and the opportunity you have given us to manage a portion of your assets. If you have any questions or need to discuss any issues, please feel free to give us a call. Sincerely, Alan R. Myers, CFA President / Senior Portfolio Manager Aerie Capital Management, LLC (866) 857-4095 www.aeriecapitalmgmt.com
1 Comment
This was a pretty volatile quarter we just went through. The broad stock market managed to eke out a new all-time high in late July before plunging 6% in just over a week. This plunge was driven by two things – a reaction to the Federal Reserve indicating that more future rate cuts were not a sure thing and a surprise increase in tariffs on Chinese goods.
Our current economy is still growing albeit very slowly at this point. We are already on a downward track as GDP growth – the measure of all output in our economy – has fallen from just over 3% in the first quarter to just over 2% in the second quarter and is expected to fall below 2% in the third quarter of the year. Mind you, a slowing economy does not necessarily mean “recession”, but when you throw additional, unplanned tariffs onto an economy that is already slowing you are setting the stage to make things worse rather than better for the economy. For there to be a recession we would need to go backwards with negative growth instead of just slowing growth. All of this uncertainty has led to a market that is trapped in a range with a lot of volatility. Investors find themselves responding to tweets and headlines with no clear direction. Everyone is hoping for a trade resolution, and no one is seriously expecting a trade resolution. What is an investor to do then? If you hold stocks and stock mutual funds you risk losses should trade talks completely break down. If you don’t hold stocks and stock mutual fund you risk losing out on serious gains should we somehow end up with a trade deal. Neither prospect is satisfying. In the end, the best thing seems to be to ‘stay the course’. Over the past quarter many of the stocks and mutual funds we have in client accounts did reasonably well. The Janus Henderson Balanced (ticker: JABAX) was up 2.60% for the quarter while the Janus Henderson Multi-Sector Income, the core bond fund we are using, was up 1.73% for the period. Among stocks – and we are still buying some individual stocks when the opportunity is right – Seaspan Corp (ticker: SSW) was up 9.70% for the quarter, Dick’s Sporting Goods (ticker: DKS) gained 18.32%, while our star holding Meritage Homes Corp. (ticker: MTH) gained a stellar 37.03% for the three months. Not all came up roses, though. We did have several holdings that detracted from performance. The biggest losses for the quarter were from Compania Cervecerias Unidas (ticker: CCU), a Chilean brewer which fell about 21.5% before we sold at the end of August, while Warrior Met Coal (ticker: HCC) was off 17.87% when we sold it at the beginning of August. The worst performer was a specialty mutual fund that we hold in a few client accounts. The AdvisorShares Trust Pure Cannabis ETF (ticker: YOLO) fell 35.58% for the quarter. While the cannabis space would seem to be one that offers up a lot of promise we are probably much too early here. We are likely to exit this position sooner rather than later though it is one that we will keep on our radar. Overall, I am moderately pleased with how the quarter turned out. I am still “tweaking” client account allocations and constantly looking to improve upon our holdings. Most of the changes that I have made or will make are largely adjustments to current holdings – adding to or subtracting from in order to adjust the amount of risk in a portfolio. While I am generally satisfied with our current lineup of funds and securities, I am always researching new ideas and funds. If I find a fund that offers better returns with similar levels of risk or similar returns with less risk, I am likely to make a change to our holdings. Speaking of securities, in my last quarterly report I indicated that I was primarily moving to mutual funds across client accounts. This seemed to worry a few clients who were afraid I was going to sell every individual stock holding and move everything into mutual funds. Let me clarify this for you. If we currently have good, solid stock holdings there is no need to sell them. Second, while I am primarily moving to mutual funds this does not mean that I am giving up completely on individual securities. We have continued to do well with individual stock picks. There are two key reasons that I will add mutual funds to client accounts. One is to gain exposure to areas that are more difficult to access or research, and the other is to invest excess cash in order to earn a more reasonable return and hopefully improve long-term performance. We did add new positions to client accounts this past quarter. We added a position in Manulife Financial Corp (ticker: MFC), and we wanted to add a position in tech company Sanmina Corp (ticker: SANM) but chose to use an option strategy instead. We obligated ourselves to purchase shares of Sanmina at $29 per share – about $2 below where the stock was priced when we entered our strategy. In exchange for taking on this obligation, we collected a premium. This premium paid us almost 1.5% on the amount of money we are risking over the 39 days until the option expires. This is a very nice return for such a short time period, so we win no matter what. We either buy the stock for a lower price or we keep this “interest” on the money we are risking. We also added a very special situation in a few smaller client accounts. We purchased shares of Parker Drilling (ticker: PKD) across a few accounts largely because the special situation limited us to buying fewer than 100 shares per account. The company is wanting to de-list from the stock exchange. In order to do so they are buying out shareholders who own less than 100 shares (what is known in the business as an “odd lot”) and will offer $30 per share to these shareholders. We paid around $21 per share and now we await the time to sell the shares back to the company and collect our profits. As I write this letter, the U.S. and China have come to a trade agreement. From all indications, the agreement is relatively weak. China is agreeing to ramp up their purchases of agricultural products and the U.S. will not raise tariffs in October as planned. The biggest and most important elements that need to be addressed such intellectual property rights seem to be off the table for the moment. Markets have reacted positively to this news of a “trade deal”, but the key thing to keep in mind is that tariffs are still in place and no real progress has been made on the biggest trade issues. I remain a bit skeptical of the efficacy and success of this trade deal especially given that there is no timeline to end the current tariffs. There is only a tentative agreement not to increase tariffs in mid-October as originally planned. Further, there was no mention made of the tariffs that are scheduled to be implemented in December. Given the weak trade deal and the continued weakness in sentiment I am still in the camp that says a recession is possible next year. It is certainly not guaranteed, and I do not wish for it, but I am prepared for it to happen. In the interim I am keeping clients invested in stocks even with the sometimes-increased volatility that can drive us all nuts. Should we continue to get partial trade deals that resolve some of the bigger issues, markets will continue higher. Should we instead inch towards a recession markets will fall. If that happens, I will adjust portfolios by cutting back on stock holdings and increasing bond investments. We can probably expect a lot of froth in the markets but little in the way of major gains or losses. This is completely frustrating, but it can create some opportunities. Much like the Sanmina Corp. trade I mentioned above, I will be strategically using options a bit more. The strategies, though, will lean to the conservative side. For example, I sold options against our shares of Dick’s Sporting Goods that obligated us to sell shares at a set price and we collected a premium for that. In fact, I have done this on four separate occasions, and we have collected about 3.68% of the price we originally paid for our DKS shares in premiums. Normally, I am not fond of these types of trades as it can limit the amount of profits we could potentially collect. However, I am convinced that we likely have more downside risk than upside potential, so these transactions have a better chance of being profitable for us. You are likely to see more transactions like this to boost cash and improve performance a bit. As always, we truly appreciate the trust you have placed in us, and the opportunity you have given us to manage a portion of your assets. If you have any questions or need to discuss any issues, please feel free to give us a call. Sincerely, Alan R. Myers, CFA President / Senior Portfolio Manager Aerie Capital Management, LLC (866) 857-4095 www.aeriecapitalmgmt.com 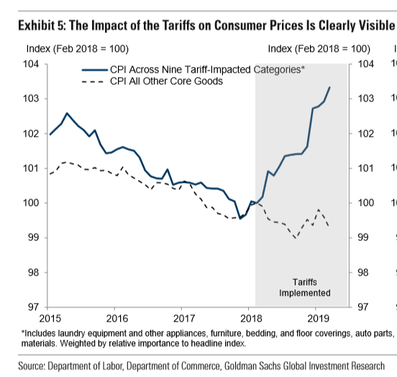 Anyone that is paying even half-hearted attention to the news today will know that stock markets here fell. A lot. News agencies are likely to use words like “melted down” or “tumbled” and they won’t be far off the mark. The key question is likely to be “what the devil happened?!” After all, it was less than a week ago that the Federal Reserve cut their interest rates by 0.25% in an effort to spur investing and keep the growth story going. Should they have cut more? Why did we fall out of bed today?
There are several key reasons and they are all interrelated. We can boil them all down to one key idea – China trade. As you know, the Trump administration has been working towards a new Chinese trade deal seemingly from the first day. China has committed some bad acts – stealing our intellectual property by forcing any U.S. tech company that wants to do business in China to have a Chinese partner firm, for example. U.S. tech companies lined up to do this with eyes wide open just to gain access to their 1.4 billion consumers. This does not mean it was fair or right. It wasn’t and practices like that needed to be addressed. We had apparently been having “productive” negotiations with China. A trade delegation returned from Shanghai on Tuesday and this was the report from the White House. Then on Thursday, President Trump tweeted that beginning on September 1, there will be a new round of 10% tariffs on the $300 billion of Chinese goods not already being taxed. The current tariffs that are in place were on what we call industrial and intermediate goods. Basically, the tariffs affected products used in production. This does not mean that we consumers did not pay these tariffs. It simply means they were more hidden. In fact, here is a chart from the U.S. Department of Labor that shows the effects of the tariffs to date. The blue line represents the change in prices for all goods that are being taxed while the dotted line represents the prices of all other goods. The shaded area represents the time the tariffs have been in place. As you can clearly see, shortly after the tariffs hit, the prices for all goods being taxed soared while the prices for all other goods has remained relatively stable. This directly contradicts the message coming out of this White House that there has been no noticeable affect of these tariffs and that China is absorbing the costs. Those are obviously false statements. The next round of tariffs this administration wants to impose starting on September 1 will more directly impact consumers. These tariffs will hit companies like Nike and Apple, for example. It is estimated that over 60% of the products affected in this upcoming round of tariffs are consumer goods such as apparel and footwear, toys and cellphones. This means the consumer – you and me – are about to be hit more directly in our pocketbooks. Now the tariffs are bad enough, but the bigger issue seems to be that this round of tariffs is signaling that a trade deal is all but off the table. You don’t have productive talks and then implement punishing tariffs. China, of course, has retaliated for this new slap in their face. The Chinese government has instructed their state-owned entities not to purchase any U.S. agricultural products. In 2017, we exported about $19.6 billion in agricultural products to China. I think it is safe to say that we will be lucky to ship a fraction of that this year. This has had a devastating impact on small American farmers. The USDA (Department of Agriculture) has tried to help these small farmers with $16 billion in aid. Basically, the USDA is paying out welfare to these farmers who have no markets for their crops. Just under a week ago, the White House said that based on those “constructive” talks, China was committed “to increase purchases of United States Agricultural exports.” In addition to banning further purchases, China did something rather extraordinary today. China allowed the exchange rate for their currency to slip below a key and significant level. Without getting too far into the weeds, what this essentially does is make Chinese exports cheaper leading to other countries buying Chinese goods that we do not or cannot purchase. President Trump is very likely to hike the tariffs to 25% to retaliate for the retaliation. We are essentially in an all-out trade war now, and there does not seem to be any hope for a deal on the horizon. At this point I believe President Trump was correct when he said the Chinese were going to wait for the elections in the hopes of getting a new administration to negotiate with. What is the outlook going forward? There are several things that I think will happen. First is that with higher costs on goods we import from China – and we will keep importing these goods from China because we cannot shift manufacturing overnight to another country or back to the U.S. – this will likely result in lower consumer spending. Second is that we are very likely to get more Fed interest rate cuts, but these won’t do anything to help the situation. Why? The biggest issue right now domestically is a lack of investment by businesses. By “investment” I don’t mean buying stocks and bonds but investing in new plants and equipment. Business spending has essentially ground to a halt. The Trump administration claimed the tax cuts would spur more business spending. Tax policy has never influenced business investment. Businesses make investment decisions based on how much of a return they can earn. Interest rates influence this far more than tax policy. And, while lower interest rates can entice businesses to invest more in plants and equipment, what businesses really want is clarity. With the world a very uncertain place right now and the trade war heating up instead of winding down businesses are looking for ways to protect themselves, not take chances on new ventures. Third, with decreased business investment, this is likely to lead to stagnant earnings at best and more likely lower earnings down the road. This is likely to result in something called “P/E compression”. Basically, investors are willing to pay a certain amount for a year’s worth of a stock’s earnings. For example, if a company earns $2 per share for the year and the stock sells for $20 per share, this is P/E ratio of 10. Typically speaking, the broad market will sell for a P/E ratio around 15 – 18 times earnings per share. That is, if the earnings for the market is $100, then a P/E ratio of 18 would imply a price of 1,800 for the S&P 500 Index. As of the end of July, based on what companies in the index had earned for the twelve months, the P/E ratio on the index was about 21 times earnings. This is on the high end of things but not outrageous. However, if investors decide that, given weaker global economies and slower growth, they were not willing to pay more than 15 times earnings, this would lead to the S&P 500 Index falling to around 2130, assuming earnings don’t change. This would be a loss of over 28% for the index! I do not expect this dramatic of a correction, and this type of a correction is not likely to happen suddenly, but I do expect investors to pay less for earnings than they have been paying recently. Fourth, I think the odds of a recession have dramatically increased. We are not there yet, but we certainly seem to be pointed in that direction. If that is the case we will want to scale back on stocks going in to the recession and load up on bonds in anticipation of the interest rate cuts. When interest rates fall, bond prices tend to rise driving up the value of bonds you own. Anticipating and being ready to act will help steer us through this mess. What did we do in the face of this turmoil today? Basically, nothing. Actually, that is not quite true. We did make one change in portfolios. We have been using the PIMCO Income fund as our “go to” bond fund. This fund has a very admirable track record but, frankly I have been worried about it in client accounts. This fund has taken some risks to achieve their returns and that has worried me. So today we moved most of our holdings in the PIMCO Income fund over to the Janus Henderson Multi-Sector Income fund (JMUTX). This fund also has an admirable track record, lower fees, is smaller and more nimble and has less risk than the PIMCO fund. In addition to this change I have been investigating an idea to take advantage of the trade war. Businesses want clarity and they want to outsource manufacturing to cheaper labor. China had provided that but that is not an option currently. Businesses are starting to look at other countries in the region as a substitute. My suspicion is that Vietnam will be a beneficiary of this trade war, so I am likely to add an investment in a fund that invests in the Vietnamese market. I will probably dip our toe in the water initially and add to it over time if it begins to pan out. Additionally, I will be gradually shifting some funds from stocks to bonds if we continue along the current trajectory. There will be a time when we will want to start buying stocks again, but this is not necessarily that time. As always, if you have any questions for me or need anything, please feel free to call me! Alan R. Myers, CFA President / Senior Portfolio Manager Aerie Capital Management, LLC (866) 857-4095 www.aeriecapitalmgmt.com We have arrived at the end of another quarter, and it has been one of more change. As you know, we have been going through a “re-boot” with a new logo and a new web site. Those were easy and cosmetic changes. The changes being made now are more fundamental to the business. You may have noticed a fair amount of trading throughout the quarter. We were gradually reallocating client accounts into select mutual funds.
This goes to the heart of one of the key changes I have implemented. In the past I have attempted to pick good stocks for client accounts. I would try to find stocks that were “mispriced” – selling for less than a calculated intrinsic value. However, times have changed. This worked reasonably well for several years. It took a lot of work, but that was the fun part for me. It was often a labor of love and when we bought into a stock that then did very well, that was gratifying. Information travels much faster now. When I was buying individual stocks, my starting point was to look at key factors that had been shown to lead to higher investment returns based on academic research. This has now evolved into a major business for large institutional investors. These firms have created funds that invest based on these “factors”. With billions of dollars pouring into these funds, it is far more challenging for old hands like me. If you Google search “factor investing” you will get 102 million search results! These firms have computers that can scan the investing universe in seconds and find stocks that meet their criteria virtually in an instant. Worse, because these funds are targeting the same factors that I was looking at the end result is that any advantage we had is arbitraged away. A decade ago, there were not a lot of people investing the way I was. Now there are billions of dollars in mutual funds and exchange-traded funds using the same factors I do and all at the same time. This results in a loss of an investment advantage and reduced returns. Therefore, I am moving my clients more and more to mutual funds. This is what you have been seeing in your accounts – the move to a few key mutual funds. This does not mean that I will stop looking for individual stocks based on the factors that I think make sense. However, I am leaving the purchase of these individual stocks to larger accounts and limiting the amount I invest in any one name to limit the risk. These larger accounts will also have a large mutual fund component as well as a “core” around which to build with the individual stocks. Everyone is benefitting from this shift to mutual funds. I can tell you the move to mutual funds has not come without a few growing pains. The search for the right funds to use in client accounts has been very challenging. There are a number of factors that I consider before settling on an appropriate fund. While performance is certainly one key factor – we definitely want funds that will provide a good long-term growth rate for us – I am looking at far more than just the best 1-year or 10-year return. I am looking at consistent performance over time. Ideally, we want funds that consistently perform in the top 25% of their peer group. However, there is far more to it than “how much did it grow?”. Another key factor is what we in this business refer to as “upside versus downside capture”. This sounds complicated but is easy to understand. I am looking at how well a fund performed when the market went up and how it performed during down markets. If a mutual fund grew faster than the markets during up times this may be good but if it lost a lot more during downturns that could be very troubling. We don’t want a fund that grows 5% more than the overall market during good times but loses 15% more during bear markets. This digs a deeper hole to climb out of for the managers. I am looking for funds that control risk – that is, funds that lose less during down markets. We can win by not losing. We have added several mutual funds across client accounts. Chief among the relatively newly added funds is the Janus Henderson Balanced fund (ticker: JABAX). This fund and the T. Rowe Price Capital Appreciation (ticker: PRWCX) fund – which is currently closed to any new investors – are the “core” funds in client accounts. Both funds will hold 50 – 70% of the fund in stocks with the balance in bonds. The manager will decide when to tilt more toward stocks and when to cut back and tilt toward bonds. Both have a long history of being relatively conservative in their investment style while not sacrificing returns. One of these funds will generally comprise anywhere from 25% up to 50% of a client account depending upon the situation, the risk tolerance and risk capacity of the client. In addition to these two core funds, we are supplementing them with the T. Rowe Price Small Cap Value (ticker: PRSVX) fund for exposure to small company stocks and a blend of the Parnassus Mid-Cap (ticker: PARMX) fund and the BlackRock Mid-Cap Growth (ticker: BMGAX) fund for exposure to mid-sized company stocks. Both small company stocks and mid-sized company stocks generally have greater growth potential but may also come with additional risks. To offset some of the risk of these additional funds, we are using the PIMCO Income fund (ticker: PONAX) which invests in bonds. So now that we are using mutual funds, what is my role? My key task now is asset allocation. That is, trying to find that blend between stocks and bonds that will serve to offer the best return that we want or need for your account with the least amount of risk. It is also my role to monitor what is happening in the economy and adjust portfolios as needed. For example, currently there is much talk of a coming recession. The big worry is the “inverted yield curve”. I wrote about this recently but let me touch briefly on it again. An inverted yield curve happens when you can earn more interest on a short-term loan (bond) than on a long-term loan (bond). Historically, whenever there is a yield curve inversion, a recession will typically occur within the next twelve to eighteen months. With the timing of the recent yield curve inversion, this would indicate a possible recession sometime between the end of this year and the middle of next year if it were to occur. As I have mentioned in past letters the Federal Reserve is largely responsible for setting interest rates within the economy. They have a couple of tools to do this, but chief among them is what is known as the Fed funds rate – the interest rate banks are charged to borrow money overnight. The Fed raised this interest rate back in December setting it effectively at a 2.38% rate. In January, the Federal Reserve turned “dovish” – that is, they indicated they were less inclined to keep raising interest rates given the on-going trade wars and signs of slowing economies around the world. Currently, markets are predicting the Fed will cut interest rates. That would be a very odd thing to do. The economy is doing reasonably well. Job growth continues at a moderate pace, unemployment is near historically low levels and inflation is virtually non-existent according to the measures the Federal Reserve uses. Typically speaking, interest rates are raised when the economy is very strong. The key reason for raising interest rates in that type of environment is to keep inflation from being a problem. Conversely, the Fed will lower interest rates when the economy is slowing, and things are turning bad. To cut interest rates now – during a strong economy – is somewhere between silly and dangerous. If the Fed were to cut interest rates by the typical 0.25%, this little if any effect. If they cut by more than that or had several rate cuts the market might infer that the economy is much weaker than it appears, which could actually spark a recession. Besides, if the Fed cuts rates now – in an economy that is still reasonably strong – when we do move into a recession there will be less room to cut interest rates to spur growth which could exacerbate any recession. I think Fed Chair Powell knows this and would like to preserve the interest rate tool for when it is really needed. With that said, should our economy slip into a recession I will be reallocating portfolios. Currently, almost everyone’s account holds more stocks than bonds. There are two key reasons for this. The first is that bonds – those with the safest credit rating – generally do not pay a very high interest rate. A very safe corporate bond would only pay about 3% interest per year. Meanwhile, you can get a dividend yield of 2.4% on high quality stocks and the potential to see your money grow 8 – 10% per year. The bond is only going to give you the 3% interest and the original investment back. The second key reason that I will reallocate to bonds should our economy start to slip into a recession is the Federal Reserve would cut interest rates to reignite growth. When interest rates fall bond prices will rise. This makes holding bonds and bond mutual funds a nice hedge to stocks in tough times. If a recession seems imminent, accounts will lean more heavily on bonds than stocks. As you can see, this investing thing is not simply “buy an index fund and forget about it”. There is a lot more involved here. While I feel like I have a great fund lineup for clients, I am always keeping my eye out for funds that may be a better fit – either because they offer a slightly better return with the same level of risk or they offer comparable returns with far less risk. In addition, I am remaining focused on how things are going in the economy, so I can adjust client accounts in order to continue meeting our investing goals. Let me emphasize that it is my job to assist you. If you have any questions or would like to discuss anything, please feel free to give me a call! As always, I am honored and humbled that you have given me the opportunity to serve as your financial advisor. Alan R. Myers, CFA President / Senior Portfolio Manager Aerie Capital Management, LLC (410) 864-8746 (866) 857-4095 www.aeriecapitalmgmt.com The markets just had their best quarter in a decade. Literally. Given how volatile they were in the fourth quarter of last year and how far down they had fallen (almost 20% in less than three months) it was no surprise to see a rebound. What was surprising was the strength of the rebound. There are many – me included – that think we have come too far too fast. It would not surprise me to see stocks sell off at some point though not likely back to the lows of December and not without a catalyst.
There are many that think we have a catalyst for a severe drop right around the corner. That catalyst’s name is “Recession”. There is a lot of talk about a coming recession. There are several factors that have led to this interest and worry. First, corporate earnings growth is slowing down. Add to that economic data that paints a worrisome if mixed picture – slow retail sales in December, a dramatic falloff in jobs in February and slowing global economies most notably in Germany and China – and you have the seeds of recession anxiety. The one sign that has set everyone on edge is the dreaded inverted yield curve. I wrote about this in a recent blog (www.aeriecapitalmgmt.com/blog) but will touch on it briefly here again. The yield curve is a measure of what you get paid for buying a bond and holding it until it matures. The longer the time until the bond matures – that is, the longer you are tying up your money – the more interest you will demand. This makes sense. If you think about CDs at your bank you earn more interest in a 2-year CD than you do a 6-month CD for this same reason. The yield curve is looking specifically at Treasury bonds issued by the U.S. Government. When the yield (interest you earn) on a shorter-dated bond is higher than that of a longer-dated bond, we have an inverted yield curve. This first happened back in December when the interest rate on a 2-year Treasury note was higher than that on a 5-year Treasury note. Then, on March 22, the interest rate on a 3-month Treasury bill spiked above the interest rate on a 10-year Treasury bond. Historically speaking the last seven recessions were preceded by a yield curve inversion. On average a recession followed a yield curve inversion by about 11 months. Pile on top of this evidence the fact that the economic expansion is now approaching its 10-year anniversary which seems, to many people, to be long in the tooth and everyone is afraid a recession is imminent. But what exactly is a recession, and why should we worry? The official arbiter of recessions in the U.S. is the National Bureau of Economic Research (NBER). This is a private, nonprofit, nonpartisan organization dedicated to conducting economic research. The NBER defines a recession as “a significant decline in activity spread across the economy, lasting more than a few months.” It is measured by data tied to “industrial production, employment, real income and wholesale-retail sales.” The key here is that the measure is not tied to just one or two sectors. Just because retail sales fall for two quarters does not mean we have a recession. And it takes some time for the NBER to call a recession. It took them nearly a year to confirm the last recession (2008) and by the time they confirmed it, it was a forgone conclusion. Why do we care about recessions? For most Americans job insecurity increases, layoffs rise, company earnings fall, retail and corporate sales slow and stock prices fall. Bear markets – a 20% or greater decline in the S&P 500 Index – are typically tied to recessions. In the last recession, the market fell almost 57% at its lowest point. It certainly pays to be both aware of and wary of recessions. At the very least one can prepare by reallocating your portfolio. The question becomes – since we have had an inverted yield curve and we are getting some slightly disturbing economic news, should we be worried about a coming recession and should we reallocate our accounts or sell everything and go to cash? The short answer is “no” to both. How do I know this? The truth is I don’t know that we aren’t heading for a recession. I am pretty confidant we are not heading for a recession in the very near future. The Conference Board, a nonprofit group of 1,200 businesses and organizations from around the world, compiles what is called the Leading Economic Index© or LEI. There are ten components to the LEI and they are leading predictors of economic activity. They run the gamut from the jobs numbers to the S&P 500 Index, the yield curve (looking for an inversion) to orders for “durable goods” (think ovens and refrigerators) to consumer expectations. Each month the Conference Board plugs the numbers into a formula, and they report on the LEI every month. All ten of these indicators tend to foreshadow things to come. For example, if businesses are cutting back on orders this could foreshadow a slowdown in sales which would lead to potential layoffs and rising unemployment numbers and waning consumer confidence and so on. Why ten of them? One or two might send out false signals. With ten, it’s more likely to indicate a true trend. Does this mean every time the LEI falls we are heading into a recession? Based on past history the lead time given by the LEI has ranged from 7-20 months before a recession occurs. However, there have been times when the LEI has given false recessionary signals including in the mid-1960’s, the mid-1990’s, the late 1990’s and even during the recent expansion we are experiencing. According to the Conference Board, the LEI has been essentially flat since October. It has correctly signaled the U.S. economy is slowing down but it has not signaled a recession yet. In fact, the Conference Board recently issued a report that is cautiously optimistic on continued growth for the U.S. economy. There have been some shifts that may forestall a recession. The Federal Reserve has made an about face from indicating they wanted to raise interest rates at least twice this year to pushing off even one interest rate hike until next year, if at all. Add to this the fact that recessions are usually preceded by major economic imbalances – a stock market bubble as in 2000 or a housing bubble like we had before the 2008 recession or the Federal Reserve sharply raising interest rates to tame inflation. None of those conditions exist – currently. I say “currently” because this could change in an instant. There are a few things I am watching cautiously. Chief among them is a China-U.S. trade deal. Everything points to both sides wanting a trade deal, but with China’s economy seemingly turning upwards again, I fear they may not need a deal as much as we need a deal. Further, I worry the current administration will see fit to crank up the tariff war if all their conditions are not met in these trade negotiations. I worry this administration will follow through on closing the Mexican border or will implement high tariffs on autos and parts coming in from Mexico. Any of these types of scenarios could tilt us over into a recession. On the flip side if we do get a trade deal and the tariffs come down nothing says we cannot continue this expansion for any number of years. In fact, Australia has gone for just over 25 years without a recession, beating out the Netherlands for the country with the longest post-war expansion. Can the U.S. expansion last 25 years? That is certainly possible. One thing some pundits like to point out is that it is different this time. We seem to be in a period of very low interest rates coupled with little or no inflation. However, I always worry when someone says “it’s different this time” as that usually means that it is not. The bottom line is that I am cautiously optimistic for continued growth. How are we navigating these waters? Currently we still have a fair amount of cash across client accounts. I did put a little to work when we had the second yield curve inversion and the markets fell around 2% for the day. I fully intend to take advantage of more opportunities like that – adding to core positions when markets fall. Should it look like we are heading into a recession, you can expect me to add more bonds to client accounts. Typically speaking, when recessions hit the Federal Reserve will cut interest rates to entice people and companies to borrow money to invest in new plant and equipment to spur economic growth. As a side effect of this when interest rates fall, bond prices will rise. For example, a 30-year Treasury bond originally issued with a face value of $1,000 back in November 2007 and paying 5% interest, could be sold today for $1,333 on the open market. Why is this? It is because interest rates are about half of what they were at the time the bond was first sold. Given this tendency I would add more bonds and bond funds to client accounts to take advantage of this fact. In the interim I am sticking with what I know. I have a model that is working well. I am looking for value stocks with momentum behind them, so we can see continued growth in price. When the model gives me stocks to buy I will add them to client accounts. Already this quarter, this model has added two Brazilian stocks in oil giant PetroBras (ticker: PBR) and phone company Telefonica Brasil (ticker: VIV). We also added an oil services company ProPetro Holdings (ticker: PUMP) and a coal company that supplies coal to the steel industry, Warrior Met Coal (ticker: HCC). In addition to my model I am always looking for special opportunities. We recently added semiconductor company Mellanox Technologies (ticker: MLNX) to several client accounts. Mellanox is being bought by NVIDIA Corp for $125 in cash. Given the price we paid we will earn a reasonably sure 5.7%, which may not seem like a lot. However, if the deal closes by the end of October as we expect, we will have over 9% on an annualized basis. As of the end of March (I run my screen monthly) there were no new stocks to add to client portfolios. This may indicate that we are at or near fair value on most stocks. If we get any pullbacks, I would anticipate having more stock names hit my list. Until then I am not going to force anything. We are not required to buy every month just because we have cash. As Warren Buffett once wrote, we can afford to sit and wait for that “fat pitch” to come to us. In other words, we can wait for great investments to come along. We do have a game plan in place for whatever is to come. If the expansion continues, we are going to continue to do what we do – finding great companies trading at reasonable valuations that have the potential to show continued price appreciation. We will also seek out those special opportunities as they come along to enhance our returns. If we do head into a recession then it is bond, bonds and more bonds. But there is no need to panic and rush into bonds or even to sell out and go to all cash just yet. The U.S. economy is still on pretty good footing even if things are slowing down a bit. As long as Congress and the current administration can stay out of the way of business this expansion could easily become the longest on record for the U.S. I will not attempt to predict whether we can make it another 15 or more years to vie for the longest expansion record. Let me emphasize that it is my job to assist you. If you have any questions or would like to discuss anything, please feel free to give me a call! As always, I am honored and humbled that you have given me the opportunity to serve as your financial advisor. Alan R. Myers, CFA President / Senior Portfolio Manager Aerie Capital Management, LLC (410) 864-8746 (866) 857-4095 www.aeriecapitalmgmt.com  There was a lot of talk Friday on business news channels about the “yield curve inverting”. This is not the first time this has happened recently, but it did seem to carry more weight this time around. The stock market fell around 2% based on this event. What exactly is a yield curve inversion and what implications does it have for us? Before getting into that let me back up half a step and explain a couple of concepts.
First, I want to briefly explain how bonds work. Think of a bond as an interest-only loan. If you buy a bond you are loaning money to a company (i.e. Tesla, IBM or ExxonMobile) or municipality or government. In exchange for this loan, the entity agrees to pay you a set interest rate for the term of the loan. At the end of this loan the entity will pay you the last interest payment and repay the original loan amount. This repayment date is known as the maturity date. Typically speaking the longer the term of the loan, the higher the interest rate paid. This makes sense. If you are agreeing to tie up your money for ten years you would demand a higher return than if you were only loaning it out for two years. This is an important concept to understand when we start talking about the yield curve. The yield curve is simply a graph of the interest rate you would expect to receive relative to how long until the bond matures. The shorter the time to maturity the lower the interest rate you would collect and the longer the time to maturity, the greater the interest rate. More specifically, the yield curve investors are concerned with is that of Treasury securities – bonds of the U.S. Government. We would start with a 3-month T-bill and move out in maturities through the 2-year note, a 5-year note, a 10-year bond and finally a 30-year bond. Suppose a 3-month bond paid you 2% in interest while a 1-year bond paid 2.75%, a 2-year bond paid 3.35%, a 5-year bond paid 4% and so forth. The normal yield curve would be a sort of gradual upslope as in this picture from Investopedia.com. (https://www.investopedia.com/terms/y/yieldcurve.asp). Again, this is normally what we would expect for investing in a bond. We would receive a bit more interest for tying up our money for each additional year. When things are dramatically different from this situation, we need to pay attention. That is where we currently find ourselves. In early December we had the first hint of things going wrong. On December 4 the interest rate on a 2-year Treasury note ended the day higher than the interest rate on a 5-year Treasury note. In other words you were paid more to invest for only two years than if you invested for five years. This is not a normal situation. The stock market fell 1% for the day. In fact, it continued to fall up through Christmas Eve where it bottomed out. In early-January Fed Chairman Jay Powell gave a presentation to a roomful of economists. He said the Fed was essentially done with raising interest rates and would be paying much closer attention to the markets (meaning the stock market, of course). This calmed markets and a rally started. But should we still be worried? Was the December inversion a blip on the radar? Should we be worried and, if so, about what? It turns out that a yield curve inversion does offer up something we should be concerned about. The yield curve inversion is a great predictor of a recession. In fact, the last seven recessions were preceded by yield curve inversions. If we really are facing a recession, why hasn’t the market melted down yet and what caused the Friday panic? March has given us some rather troubling economic data. One key economic report people pay attention to is the jobs report – the report of the number of new jobs that were created in the economy for the prior month. In early-March we received the report for February. Economists had been expecting 190,000 new jobs but the report came in at only 20,000 new jobs for the month. This is also well below the average of over 220,000 new jobs added each month for 2018. In addition, there have been reports from around the globe of slowing economies. Manufacturing in Germany hit a multi-year low last week. We learned that retail sales in December were far lower than anyone expected. The Federal Reserve met this past week to discuss whether to raise interest rates again. They had a two-day meeting, releasing the results on Wednesday. As was widely expected interest rates were left unchanged. In fact, they stated they did not expect to raise interest rates at all this year and perhaps only once next year. This received the lion’s share of the press. However, what disturbed me most – and was not very widely discussed in the financial press – was what the Fed’s outlook was for the U.S. economy. In announcing their rate decision, the Fed accompanied it with commentary on what went into the decision. The key takeaway for me was their comment about lowering the expectation for growth in the U.S. economy for this year. The Fed cut their expectation for economic growth from 2.3% back to 2.1% for this year. Let me be clear. The fact that our economy may slow from 3.4% growth last year to just over 2% this year is not a recession. It is a disturbing trend, though. If the inverted yield curve prediction is correct we are likely to enter a recession early next year. Believe it or not, as troubling as the yield curve inversion was in December, that is not what led the markets to fall on Friday. When the interest rate on the 3-month Treasury bill rose above the interest rate on a 10-year Treasury bond on Friday investors were ready to see the worst. This was almost confirmation of what happened back in December. Investors greeted this news by selling in droves. The broad stock market fell about 2% for the day. The small cap index Russell 2000 fell over 3.5% for the day. Whether this continues into next week or not is anybody’s guess. Again, I will reiterate that a recession is not right around the corner. However, this knowledge of what could happen and when gives us the advantage of being able to re-position accounts for a potential recession. For example, if our economy does turn negative, the Fed is more likely to cut interest rates next year rather than raising them. This would bode well for bonds giving us one place we might look for safety. Does this potential meltdown frighten me? Not at all. I have been expecting this. In fact, I would welcome a pull back in the broad market. After bottoming out on Christmas Eve the markets rallied over 21% through last Thursday. This was, in my opinion, too far too fast. If markets do fall it would give me the chance to put some of the cash in client accounts to work. In fact, I did a little bit of that on Friday. I am ready to continue this trend on Monday, but I also have two or three other ideas in mind as well. When markets move in extremes like this there are pockets of inefficiency. Stocks get mispriced and offer up tempting investment opportunities. I have a list ready of ideas that I would love to pounce on if given the chance. As always, I welcome your questions or feedback! I started out to write a blog earlier this week about the Federal Reserve and their balance sheet and discovered that I was spending way too much time trying to explain myself rather than just writing. This is when it dawned on me that many people probably have little to no idea how financial “stuff” works. Exactly what is a bond and how does it work? What does the Federal Reserve do, and why do I care? What is the difference between a mutual fund and an ETF (exchange traded fund)?
With that in mind I decided to embark upon a series of blogs that will attempt to explain many financial concepts. If you have an idea or concept in mind that you particularly want addressed, please feel free to leave me a comment below or drop me an email with the request. For now, I thought I would like to start with a concept that even the President seems not to quite comprehend but is quite relevant currently – trade deficits. This is particularly timely as it was announced this week that our trade deficit is at record levels despite tariffs. I recently watched an informal news conference Trump did from the Oval Office. During the question and answer time one reporter asked about a trade deal with China. Trump’s answer included a line that took me aback. In attempting to explain the current negotiations with China, Trump stated: “Our country lost $800 billion last year with trade. Eight hundred billion.” On the face of it, this sounds quite scary! We lost HOW MUCH?! We need to stop this! Immediately! But wait a minute…. Lost how? Did we really “lose” here? What the President was referring to is our trade deficit. Let me explain what a trade deficit is and how we are not, in fact, “losing” when we have a trade deficit with another country. Let us start with the basics. The U.S. manufactures many things – Fords, Budweiser beer, Jack Daniels whiskey, Harley Davidson motorcycles and so on. At the same time, other countries manufacture things we want – BMW’s, Apple iPhones, Nike sneakers, Moet champagne and so on. We send Budweiser beer to Europe while they send Moet champagne here. This is international trade. At the end of the day, the government scorekeepers add up how much we shipped overseas and subtract from that what we spent buying goods shipped to us from other countries. If we shipped and sold more Budweiser or Harley Davidsons than we spent on Moet or Mercedes, we have a trade surplus. If we bought more foreign goods than foreign nations bought from us, we have a trade deficit. So, with that concept in mind, a trade deficit simply means we bought more goods from foreign manufacturers than we shipped and sold overseas. Does that mean that we “lost”? After all, if we want champagne more than we want Budweiser, is that a negative thing? Let me explain this another way. If I fill up my gas tank and pay cash for the gas, I now have a trade deficit with the gas station. I have sent more money to their side of the ledger than I have received from them. But here’s the rub. I got a benefit for that $25 “trade deficit”. I received the benefit of a tank of gas. Am I worse off for having spent the money? No, of course not! This is exactly how trade deficits work in the real world. If we send more money overseas than we take in, we have a trade deficit, but we have (presumably) received some benefit from this bargain. We have more Samsung Galaxy phones and Nikes and BMWs than we did before. This is not necessarily a bad thing. Where I think people – including the President – seem to miss the boat is conflating a deficit with “bad for America”. Just because we buy more goods or services from a country than they buy from us does not equal “bad for America”. In fact, we must have received some benefit from this relationship like my tankful of gas, or we would not have made those purchases. We wanted those Nikes or BMWs or Samsung Galaxy phones. Our biggest trade debt is with – no surprise here – China. We mainly import consumer electronics, clothing and machinery from China. The first two should be no surprise. Think Apple iPhones or Nike shoes. Even the President’s family isn’t immune from outsourcing to China as first daughter Ivanka, until the middle of last year, ran a now shuttered clothing line that was manufactured in China. Why don’t U.S. companies keep all manufacturing here at home? Cost is obviously one answer. It is much cheaper, even with shipping, to have an iPhone made in China than here at home. With minimum wages going up throughout states, either by law or by pressure from other companies, these labor-intensive jobs are likely to remain offshore. Let’s dig a little deeper into how we rack up a trade deficit, even on goods that are made here. One of the key items traded in the NAFTA zone – Canada, the U.S. and Mexico – is auto parts. The Ford Escape is assembled in Kentucky making it an American-made car. However, 55% of the parts that go into the car, including the entire engine, come from Mexico or Canada. The engine that we purchase from Canada counts in the calculation of what is bought and sold between countries. That is, when we purchase engines without shipping something of equal or greater value back to Canada, we have incurred a trade deficit. So, the Ford Escape is assembled and resold mainly in the U.S. with Canadian engines and we end up with a trade deficit. But did we lose on this deal or not? Presumably, if Ford could source engines as cheaply here in the U.S., they would. Using Canadian engines is apparently saving Ford on the cost of building the Escape and allowing consumers to more easily afford this vehicle. That would seem to be a benefit to everyone involved – Canadian and American. The bigger issue and thornier question concern the outsourcing of manufacturing to foreign countries at the expense of American jobs. I don’t pretend to have any easy answers here. From an economic standpoint, I would argue that we should outsource some manufacturing overseas to countries with cheaper labor. I do have a problem with using child labor at $1 a day, even if that wage is high for that country. There is no one single answer to the question of whether we should outsource or not. In the end, if we are getting the products we want at prices we want, outsourcing to other countries can be mutually beneficial. I would love to hear your thoughts and ideas below. The last quarter was one of extreme volatility. In fact, the fourth quarter had more days where the market moved 1.5% or more since….2011. Yeah, I don’t remember what exactly happened back then either, so I had to dig out my 2011 year-end letter to see what caused such volatility back then. This was the year of the “Greek debt crisis” when markets worldwide were roiled over the fears that Greece would go bankrupt, and this bankruptcy would start another contagion like the 2008 meltdown. Markets fell around 14% in the third quarter of 2011 only to come roaring back in the fourth quarter. To find a fourth quarter that had both this much volatility and a decline of 14% or more we must go back to 2008, and the start of the financial crisis. No wonder I was having flashbacks during October and early November. I do admit that my stress level was through the roof for a bit over client accounts.
At least this time around we are not in the middle of a financial crisis, though you wouldn’t necessarily know it from the fears and rumors that flew around. There were several factors that all occurred in short order that caused markets to plummet quickly. The interest rates on 30-year Treasury bonds spiked dramatically (for bonds, anyway), jumping 5% in three days. This led to a fear of inflation. Add to that Amazon’s announcement they are raising their starting pay to $15 per hour for all employees. If Amazon is paying that everyone else will have to match them, leading to pressure on wages and likely forcing companies to raise prices to cover these higher wages. Then we move to the second week of October…. Seriously, those two incidents merely lit the fuse of fear and uncertainty. We had (and still have) the ongoing trade wars with China. We did face the prospect of the G20 Summit in Argentina – a meeting of the 20 largest economies in the world – at the end of November. Chinese and U.S. officials met at the summit to discuss the ongoing trade issues, but little came from that dinner. The best we achieved was a 90-day delay in the threat to increase tariffs on Chinese goods coming to the U.S. When conflicting reports came out just a couple of days after the meeting about when the clock started ticking on those 90 days – in other words, just when might tariffs go up – the uncertainty led to another 3% drop In addition, in December we had the fourth interest rate hike of the year from the Federal Reserve and Fed Chairman Jerome Powell spoke about the decision to increase rates. The message he conveyed was essentially “we may raise rates a couple of more times in 2019, but it depends upon what the data tells us”. What the markets wanted to hear was “we are done raising interest rates given how far stocks have fallen”. The way Chair Powell conveyed his message further spooked the markets causing another big leg down. It’s funny, because in early January, Chair Powell was at the American Economic Association’s annual meeting in Atlanta and essentially said the same thing as he did in December – he just used what is referred to as a more “dovish” tone – and markets reacted by jumping near 3.5% for the day. So what happened in our accounts? As you know, one thing that I do when I purchase any security is I set a “stop loss” on each holding. That is, if the stock price falls to a certain level, I will exit the position. Given how the markets fell this quarter, we did a lot of selling. We closed out most of our stock positions during the quarter. Only four of the fourteen stocks we sold resulted in a net loss. What didn’t help, though, was selling stocks that had been 10%, 15% even 20% or more higher just days or weeks earlier. For example, we sold Ecopetrol (ticker: EC) in November at around $19.60 per share. This was over 27% below where the stock traded at the end of September but was well above the $12 per share we originally paid when we first bought shares. Similarly, we sold Best Buy for $71 per share, which was, again well above the $59 we originally paid but 10.5% below the price at the end of September. However, I still think we did the right thing to bail out of the stocks when we did. For example, we sold out of Macy’s (ticker: M) for just over $30 per share in mid-December. Today, as I write this letter, Macy’s suffered almost an 18% drop for today, falling to $26 per share on very weak sales during December. Aside from the loss in value on our stock holdings, the other issue we faced was from our options. Through the end of September, we had done reasonably well with options transactions. This all reversed in the fourth quarter as the extreme volatility hit pretty hard. We did try to exit some of our positions but oftentimes the market moved so quickly the orders we entered were never executed. In hindsight I do wish I had “chased” some of the orders that I placed – that is, instead of setting a certain price, just bailing out regardless – but there was no way to know how much the markets would melt down and how quickly. Going in to the quarter, we had always experienced a “buy the dip” mentality. That is, whenever we had a sharp drop in the markets, investors seemed to view it as a buying opportunity. This time around, it turned into a “sell the rally” type of mentality. That is, whenever markets jumped, investors used it as an opportunity to sell stocks (much as we did). I certainly tried to make the best decisions possible to minimize losses. Markets just did not seem to want to cooperate or make things easy for me. Combine these two events and suffice it to say that I was not happy with how client accounts performed for the quarter. I am better than what occurred this past quarter. This was a “perfect storm” of what could go wrong. So, in the short-term, things have been less than fun. The big key is to remain focused on the long-term view. Over the long-term, stocks will do well – much better than the rate of inflation, so it is important that we remain exposed to stocks. I will say that, for now, the model that I am using to find stocks to purchase is not giving me any purchases. That does not mean we won’t have any exposure to stocks at all. We do have some exposure to small and mid-sized companies through mutual funds we hold. In addition, I am in the process of adding a good balanced fund – a mutual fund that holds both stocks and bonds – as a ‘core’ holding to client accounts. This fund, the Janus Henderson Balanced fund (ticker: JABAX), has a great and consistent long-term track record, which is what I want for my clients. I am working on “tweaking” my model to see if I can reduce the volatility it has shown but maintain solid long-term returns. We are currently a bit overweight in bonds, primarily through the PIMCO Income mutual fund (ticker: PONAX) across most client accounts. I am a bit worried about the potential for a recession. Much will hinge on what happens with the current trade negotiations with China. The expectation is that all will go wonderfully. I am not so sure, and even if there is an agreement reached, it won’t be a quick end to things. Should negotiations fail the administration is threatening to raise tariffs on Chinese goods to 25% from the current level of 10% and to spread these tariffs to all Chinese goods imported into the U.S. While this may have a somewhat muted impact on the overall economy at first the longer-term implications are darker. These tariffs would hit lower- and middle-income folks hardest. Until this threat is somewhat resolved one way or another I would prefer to prepare for the worst and hope for the best. Should we get clarity on trade issues, we will be shifting money out of the bonds and into stocks, though not everything will come out of bonds of course. With clarity comes the ability to take on a bit more risk. The amount of risk, of course, will depend upon your individual situation, needs, and age. The bottom line – in spite of a very tough fourth quarter, we remain focused on what we do. We are focused on protecting client accounts and trying to earn a reasonable return for the amount of risk that we take. This has not and will not change. How we achieve those goals may shift a bit over time, but the goals remain the same. Over the past several years, we have had little or no volatility. That has likely changed now, which means we may see some larger swings over short spans of time. We will bounce back. The general trend in markets is higher which is in our favor. While we may endure short-term bumps and jolts we should see long-term growth of our assets. The best thing to do is fasten your seatbelts and not worry about day-to-day changes in account values. As always, we truly appreciate the trust you have placed in us, and the opportunity you have given us to manage a portion of your assets. If you have any questions or need to discuss any issues, please feel free to give us a call. Sincerely, Alan R. Myers, CFA President / Senior Portfolio Manager Aerie Capital Management, LLC (866) 857-4095 www.aeriecapitalmgmt.com |
 RSS Feed
Contact us
|

|
© COPYRIGHT 2015. ALL RIGHTS RESERVED.
|